
What impact would it have if once a day a child’s energy-dense snack was instead replaced by a serving of fruit or vegetables?
Amid rising numbers of overweight and even obese children in the US, the USDA’s Economic Research Service (ERS) has updated its assessments of just such an impact on both household food spending and children’s caloric intakes.
The ERS findings include that in most cases replacing a snack with a fruit or vegetable reduces calories consumed, and in some cases it is also cheaper. For example:
- Replacing a 2.6-ounce fruit Danish with 5.2-ounce portion of apples would reduce intake by 194 calories. It would also save a household 11 cents.
- Replacing a one-ounce portion of a chocolate-chip cookie for a 5.2-ounce portion of apples would reduce caloric intake by 46 calories, though it would cost the household an additional 20 cents.
Which fruit and vegetables are particularly good for kids’ snacks
The ERS estimated the average costs for 156 fresh and processed fruits and vegetables as well as the price per portion for 20 snack items commonly consumed by children ages 6-13, including salty snacks, baked and sweet goods, and frozen treats. It also identified and priced 20 fruits and vegetables seen as potential replacements for these snack foods.
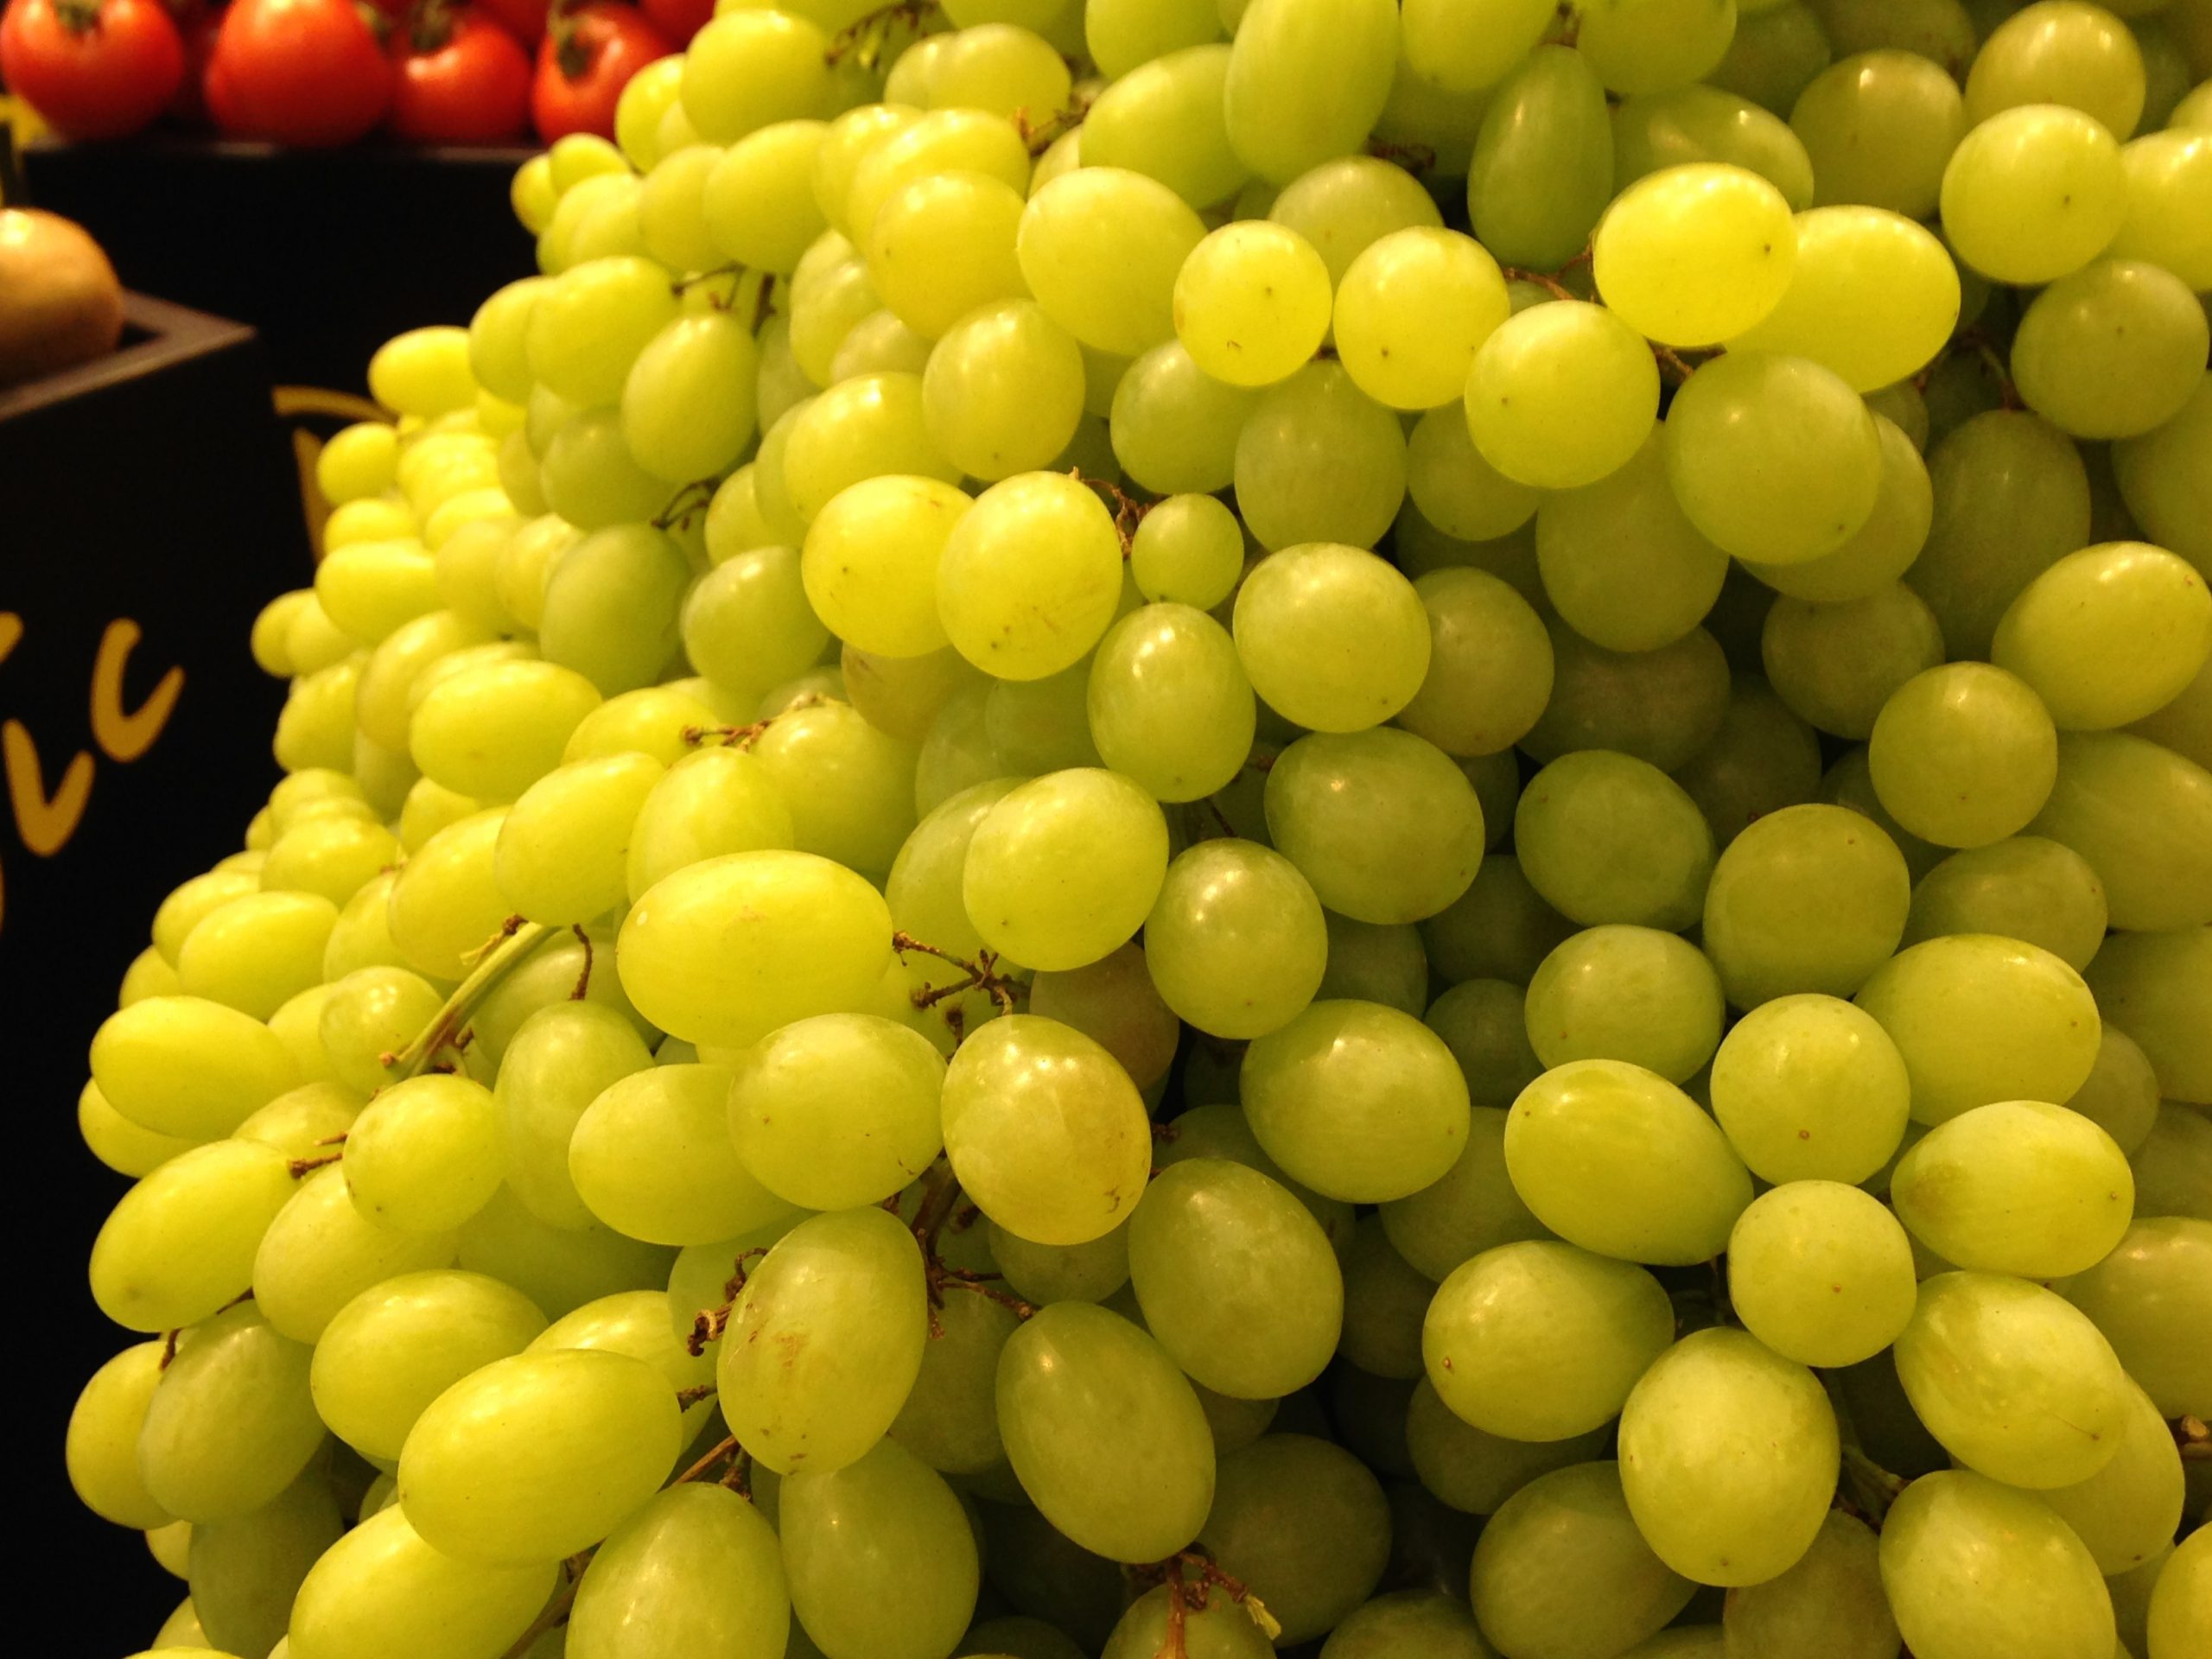
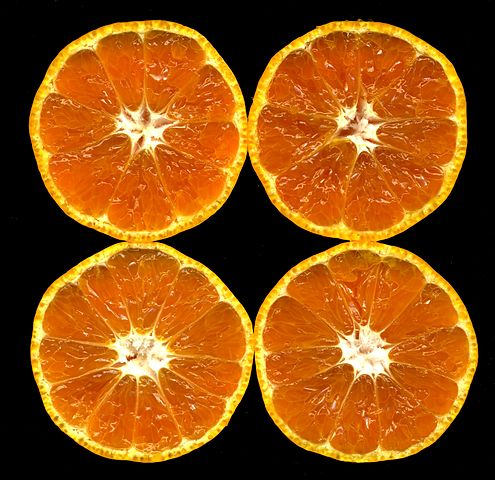
The potential fruit replacements were apples, bananas, cantaloupe, tinned fruit cocktail, grapes, oranges, canned peaches, canned pineapple, plums, raisins, strawberries, tangerine and watermelon.
The vegetable ones were broccoli, carrots, celery, red peppers, sweet potatoes (cooked) and tomatoes (grape or cherry).
See the ERS data here.


